


Abstract
Objectives: The brain and spinal cord, constituting the central nervous system (CNS), could be impacted by an inflammatory disease known as multiple sclerosis (MS). The convolutional neural networks (CNN), a machine learning method, can detect lesions early by learning patterns on brain magnetic resonance image (MRI). We performed this study to investigate the diagnostic performance of CNN based MRI in the identification, classification, and segmentation of MS lesions.
Methods: PubMed, Web of Science, Embase, the Cochrane Library, CINAHL, and Google Scholar were used to retrieve papers reporting the use of CNN based MRI in MS diagnosis. The accuracy, the specificity, the sensitivity, and the Dice Similarity Coefficient (DSC) were evaluated in this study.
Results: In total, 2174 studies were identified and only 15 articles met the inclusion criteria. The 2D-3D CNN presented a high accuracy (98.81, 95% CI: 98.50–99.13), sensitivity (98.76, 95% CI: 98.42–99.10), and specificity (98.67, 95% CI: 98.22–99.12) in the identification of MS lesions. Regarding classification, the overall accuracy rate was significantly high (91.38, 95% CI: 83.23–99.54). A DSC rate of 63.78 (95% CI: 58.29–69.27) showed that 2D-3D CNN-based MRI performed highly in the segmentation of MS lesions. Sensitivity analysis showed that the results are consistent, indicating that this study is robust.
Conclusion: This metanalysis revealed that 2D-3D CNN based MRI is an automated system that has high diagnostic performance and can promptly and effectively predict the disease.
Multiple sclerosis (MS) is an inflammatory neurological condition that affects the central nervous system (CNS). Specifically in the brain’s white matter, it causes demyelination and inflammation of the nerves. As a result, it can slow down or block messages between the brain and body. The World Health Organization (WHO) revealed that MS affects 2.8 million people globally, and its prevalence is increasing every year.1 North America, Europe, and Australia have most of the MS patients.2 Fatigue, trouble walking, stiffness, weakness, vision issues, vertigo, cognitive changes, emotional changes, sadness, and more are all typical MS symptoms.3,4 To date, the etiology of MS remains unclear.5 The MS is thought to be caused by a confluence of hereditary and environmental factors.6 Geographical location, vitamin D insufficiency, obesity, and smoking are examples of environmental factors that may be related to MS. The early detection of MS presents long-term benefits and could help researchers to find the best clinical strategy of this condition.7 There are currently no signs, physical observations, or laboratory testing that can alone indicate if you have MS. There are several methods used to assess if you match the recognized standards for an MS diagnosis and to rule out other potential causes of the symptoms you are presently exhibiting. A thorough medical history, a neurologic examination, and numerous diagnostics, such as magnetic resonance imaging (MRI), spinal fluid analysis, and blood testing, are some of these measures.8 Currently, the standard non-invasive diagnostic modality of MS uses MRI to visualize the lesions and presents a major role in controlling prognosis and development of the disease.9 The use of quantitative MRI techniques improves understanding of the extent of tissue damage and disease. These methods consist of: (1) MR spectroscopy, a non-invasive technique for examining the biochemical changes in MS;10 (2) magnetization transfer imaging which offers improved sensitivity and specificity for MS studies;11 (3) diffusion weighted imaging (DWI) and diffusion tensor imaging (DTI) which are quantitative MRI techniques, providing information on size, integrity, geometry, and orientation of tissue fibers;12 (4) dynamic contrast enhanced MRI which enables quantification of blood brain barrier disruption;13 and (5) dynamic susceptibility contrast MRI, which by injecting contrast agent into the patient produces quantitative maps of cerebral blood flow, cerebral blood volume, and temporal metrics like mean transit time.13 To date, the accurate diagnosis of MS lesions presents some inconvenient. It was showed that MRI are difficult and time-consuming modalities in the diagnosis of MS because it is difficult to manually detect most of the lesions, especially within the grey matter.14 Moreover, interobserver variability can lead to inaccurate results, and the inability to compare studies from several modalities is a significant drawback. Also, methods that include human interplay may be characterized by substantial inter observer variability that may hamper the quality of the final results. Thus, new modalities were proposed to correctly detect MS lesions. Recently, deep learning (DL) tools, using artificial intelligence (AI), have developed for the diagnosis of various diseases, attracting many physicians’ attention.15,16 Different DL techniques using MRI were proposed for the diagnosis of MS. The principal advantage of DL methods is their capacity to deduct intrinsic image representation in MRI data.17 Furthermore, DL does not need any manual guidance of the characteristic extraction step.18
Since 2016, research on the use of DL architectures and MRI data for the diagnosis of MS have been conducted. Identification, segmentation, and classification of MS lesions were investigated by DL models. Conventional neural networks (CNN) are one of the most widely employed architectures in MS diagnosis.14 It learns characteristics of lesions using multinomial logistic regression to improve the diagnosis of MS.19 The majority of physicians used 2D- and 3D-CNN architectures for classification and segmentation of MRI techniques. These networks’ capacity to reuse weights and lower parameter counts make them more compatible with 2D and 3D images.14 Given that 3D images contain a lot more information than 2D images, it makes some sense that the 3D CNN will perform better than the 2D version. The CNN designs and/or training/testing dataset variances may be the root cause of the underlying variations. A 3D CNN requires far more processing power for training and inference than a 2D CNN.
The objective of this metaanalysis is to assess the effectiveness of MRI based 2D-3D CNN architectures on the diagnosis of MS.
Methods
Resources and search techniques
We followed the Preferred Reporting Items for Systematic Reviews and MetaAnalyses (PRISMA) standards to conduct this study.20 The following databases were used to find relevant papers published from January 2010 until December 2022: Web of Science, PubMed, CINAHL, Google Scholar, Embase, and the Cochrane Library. Two independent reviewers performed a systematic search using the following terms “multiple sclerosis” AND “magnetic resonance imaging” OR “MRI” AND “machine learning” OR “artificial intelligence” OR “deep learning” OR “convolutional neural networks”.
Selection criteria
After suppression of duplicates, title and abstract checks were done on pertinent papers. Papers were included if they reported the use of 2D- or 3D-CNN for the identification, classification, or segmentation of MS lesions. They were then fully read to ensure eligibility.
Study inclusion criteria were: (1) Papers reporting MS lesions; (2) identification, classification, or segmentation of MS lesions using a CNN method; (3) use of 2D- or 3D-CNN architecture; (4) use of MRI as neuroimaging modality; (5) original research papers; and (6) articles reporting sufficient information about the performance of CNN.
Study exclusion criteria were: (1) Papers written in languages other than English; (2) letters, comments, opinions, guidelines, protocols, and review papers; (3) use of other architectures of CNN (4D-CNN Models, DeepSCAN); (4) overlapping study groups and duplicate publications; (5) studies with scant information on the results.
Data extraction
Two independent authors retrieved information from the eligible articles following the inclusion and exclusion criteria, and information were collected on a standardized data sheet that included: (1) article, (2) country, (3) dataset, (4) sample size, (5) diagnosis application, (6) neuroimaging modalities, (7) deep learning method, (8) deep learning architecture, and (9) performance.
Study Quality Assessment
The methodologic quality of the included studies was evaluated independently, by 2 authors, using the Quality Assessment of Diagnostic Accuracy Studies-2 (QUADAS-2) tool, which includes four criteria that judge bias and applicability: “patient selection”, “index test”, “reference standard”, and “flow and timing”.21 Each is assessed in terms of risk of bias, and the first 3 domains were also assessed with respect to applicability. Each item is answered with “yes,” “no,” or “unclear.” The answer of “yes” means low risk of bias, whereas “no” or “unclear” means the opposite. Consensus was used to settle disagreements, while arbitration with a third reviewer was an option if necessary. RevMan Version 5.4 (Cochrane Collaboration, Oxford, United Kingdom) was used to visualize the quality assessment results.
Outcome measures
Accuracy: It measures the ability of 2D- or 3D-CNN to detect MS when it is present and detect the absence of MS when it is absent.
Sensitivity
It refers to 2D- or 3D-CNN’s ability to designate an individual with MS as positive.
Specificity
It refers to 2D- or 3D-CNN’s ability to correctly classify an individual without MS disease.
Dice Similarity Coefficient (DSC): It is a spatial overlap index and a reproducibility validation metric that measures the similarity between two sets of binary segmentation results.
These measures were used for the :(i) identification of MS from healthy controls, (ii) classification of MS lesions from other brain lesions, and (iii) segmentation of images produced by MRI for measuring and visualizing the brain’s anatomical structures, for analyzing brain changes and for delineating MS lesions.
Statistical analysis
Accuracy, sensitivity, specificity, and dice similarity coefficient measures were pooled from the included studies. Statistical analyses were conducted by RevMan Version 5.4 (Cochrane Collaboration, Oxford, United Kingdom). A p-value <0.05 was considered significant. Heterogeneity was assessed by the Cochrane chi-squared test. A p-value <0.05 confirms the presence of heterogeneity. In order to assess the influence of heterogeneity on the results, we calculated I2 values; I2 values ≥50% and p<0.05 indicated an important level of heterogeneity. If I2<50% and p>0.05, we used a fixed effects design; if not, a random effects model was adopted.22 We also performed subgroup and sensitivity analysis to identify the cause of heterogeneity. To assess publication bias, a visual examination of the symmetry in funnel plots was used. This second point was supported by Egger’s test using the SPSS V25 statistical package.
Results
Identification of studies
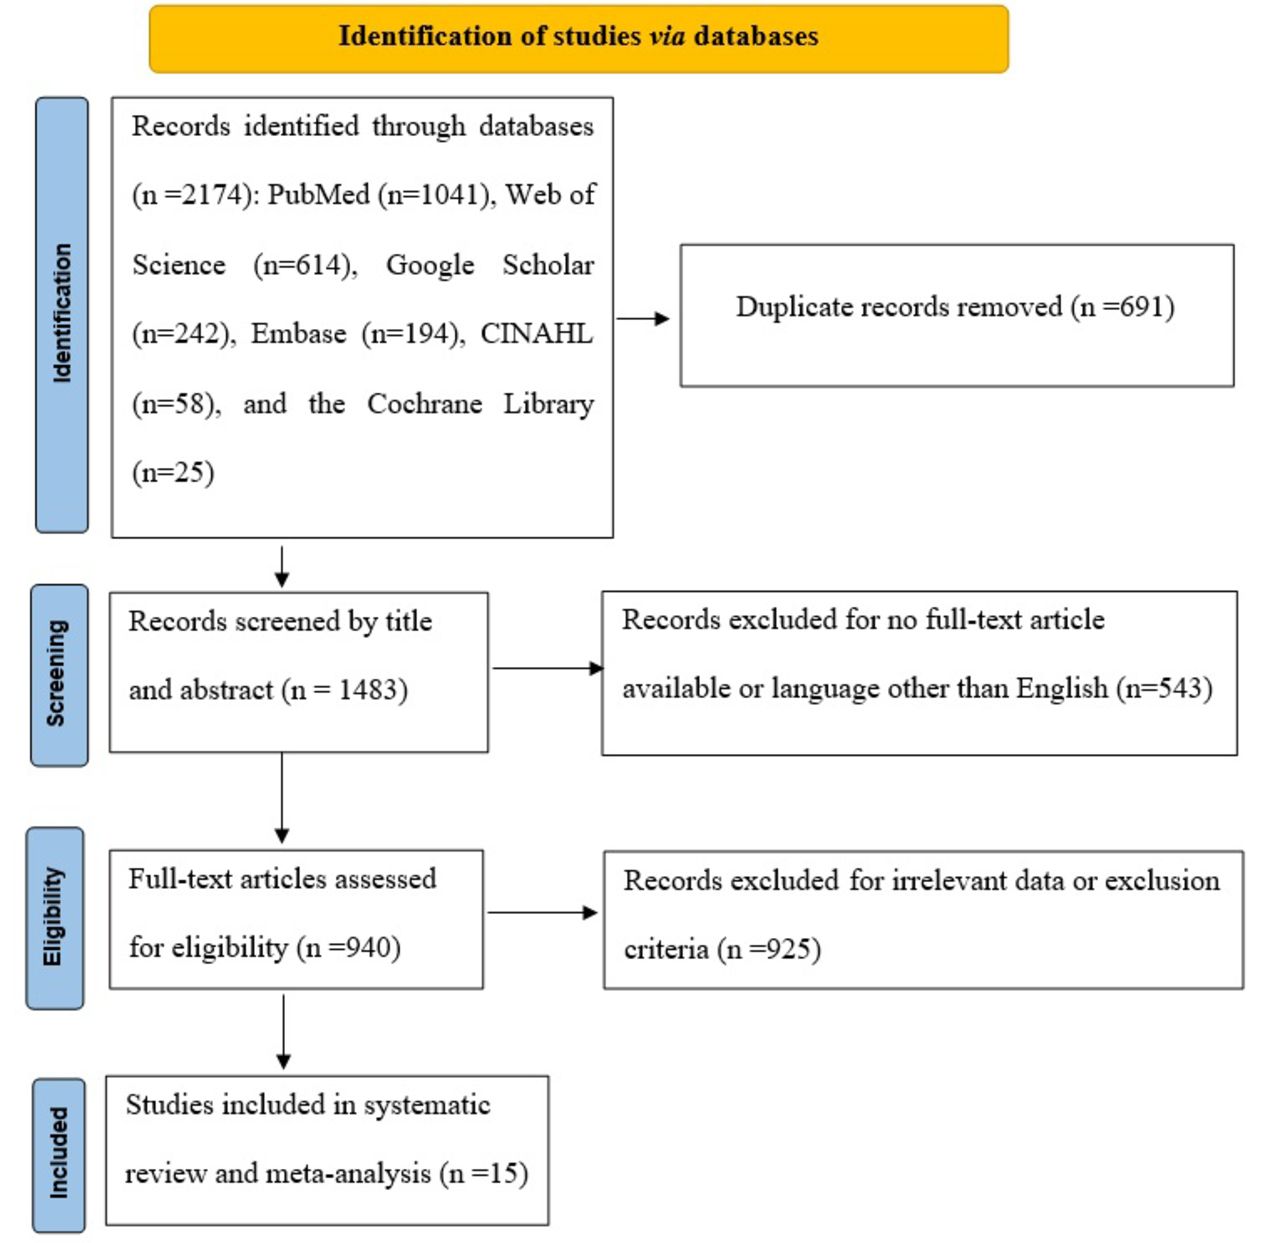
Literature search identified 2174 papers to be screened, of which 691 studies were duplicates and were removed. Hence, 1483 papers were screened by title and abstract and 543 were excluded for no full text article available or language other than English. Finally, 940 studies of which 940 studies were identified as potentially eligible and then were full text reviewed. Fifteen publications satisfied the eligibility requirements and were included in this study. The flowchart for the PRISMA study is shown in (Figure 1).

- PRISMA study flowchart.
Characteristics of studies
The 15 studies were released between 2018 and 2021 and were came from nine nations: Australia (n=2), Iran (n=2), Italy (n=2), USA (n=2), China (n=2), Spain (n=2), Switzerland (n=1), India (n=1), and Germany (n=1). The number of patients ranged from 19 to 1111. Three, four, and eight studies reported the effectiveness of 2D- and 3D-CNN in the identification, classification, and segmentation of MS lesions, respectively. Study features are represented in (Table 1).
- Features of included studies
For the clinical diagnosis of MS, it is crucial to identify brain lesions utilizing MRI modalities. Medical professionals have significant challenges when trying to segment and categorize brain lesions obtained from MRI modalities and are at risk of making errors in diagnosis. Many elements, including artifacts, intensity heterogeneity, etc., have a negative impact on the MR image’s quality, which frequently results in disease misdiagnosis. The low level and high level preprocessing techniques used by MRI neuroimaging modalities to diagnose MS are covered in the sections that follow. Computer aided diagnosis system (CADS) performs better when high level preprocessing techniques are used in conjunction with low level preprocessing approaches. Data augmentation (DA), patch extraction, and other techniques are among them. Table 2 provides a summary of the specific preprocessing data used by each article to diagnose MS utilizing DL techniques and MRI modalities. There are many toolboxes available for implementing DL models. Table 2 lists the tools used to create DL architectures. TensorFlow and Keras are the most significant DL tools. The final component of the DL-based CADS displayed in Table 2 is the activation function of the final layer used for classification in DL models. It can be noted that, the SoftMax function has yielded the highest classification performance.
- Summary of CADS developed for MS using MRI neuroimaging modalities and details of deep learning architectures.
- Summary of CADS developed for MS using MRI neuroimaging modalities and details of deep learning architectures.
Evaluation of the studies’ quality
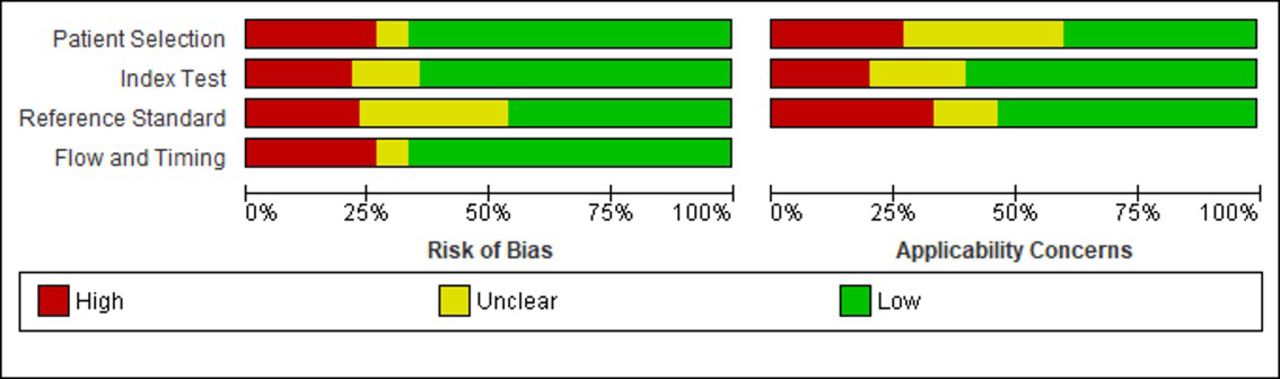
A high risk of bias was revealed in approximately 25% of articles regarding patient selection and flow and timing criteria. In most of the papers (75%), a certain threshold was provided in relation to the index test criteria. Moreover, in terms of reference standard, a low risk of bias was detected in less than half of the included articles. We noticed that approximately similar results were found for applicability concerns (Figure 2). Indeed, the highest concerns were detected in reference standard criteria (33,33%), followed by patient selection (26,67%) and index test (20%).

- Risk of bias and applicability concerns graph: review authors’ judgements about each domain presented as percentages across included studies
Types of application and outcome measures Identification
Of the 15 included studies, three studies evaluated the diagnostic effectiveness of 2D- or 3D-CNN in the identification of MS lesions using accuracy, sensitivity, and specificity (25,36,37).
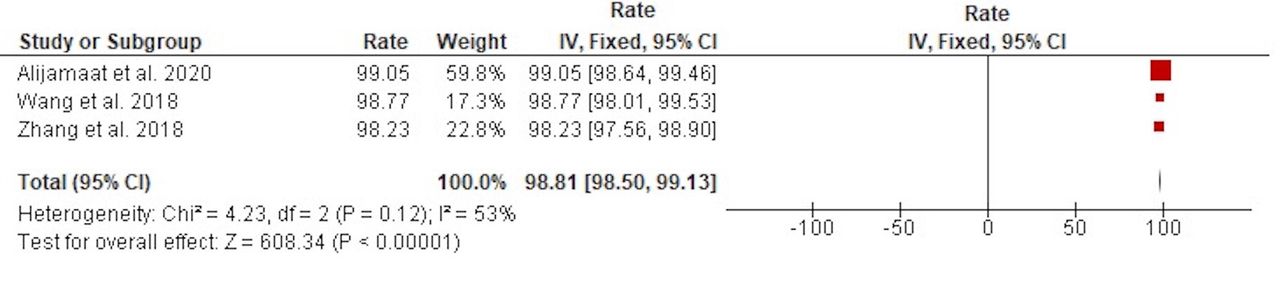
Accuracy
The heterogeneity was low (Chi2=4.23, p=0.12, I2=53%), so a fixed effect design was used. We revealed that the overall accuracy rate was significantly high at 98.81 (95% CI: 98.50–99.13; p<0.00001) (Figure 3).

- Pooled accuracy rates of 2D-3D CNN in the identification of MS lesions
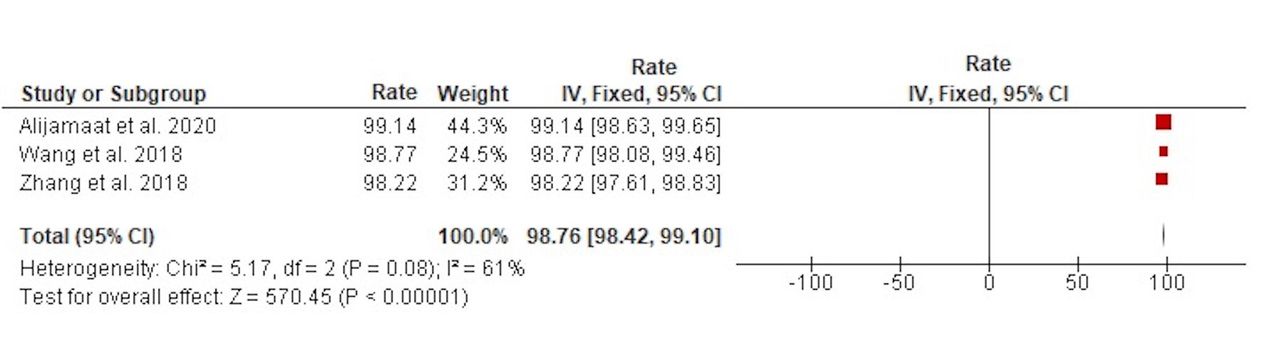
Sensitivity
The heterogeneity was low (Chi2=5.17, p=0.08, I2=61%), so we used a fixed effect model. The analysis revealed that the overall sensitivity rate was significantly high at 98.76 (95% CI: 98.42–99.10; p<0.00001) (Figure 4).

- Pooled sensitivity rates of 2D-3D CNN in the identification of MS lesions.
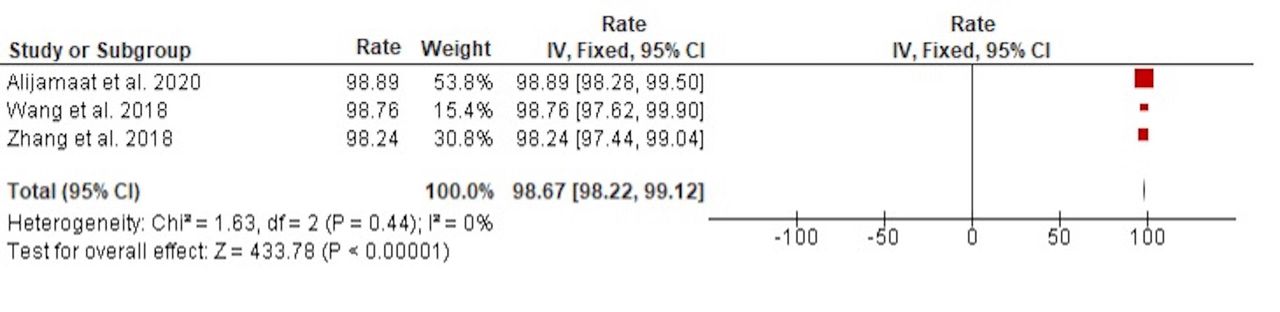
Specificity
The heterogeneity was low (Chi2=1.63, p=0.44, I2=0%), so we used a fixed effect model. The analysis revealed that the overall specificity rate was significantly high at 98.67 (95% CI: 98.22–99.12; p< 0.00001) (Figure 5).

- Pooled specificity rates of 2D-3D CNN in the identification of MS lesions.
Classification
Using accuracy, four of the 15 included studies examined the diagnostic efficacy of 2D- or 3D-CNN in the classification of MS lesions.23,29,33,34
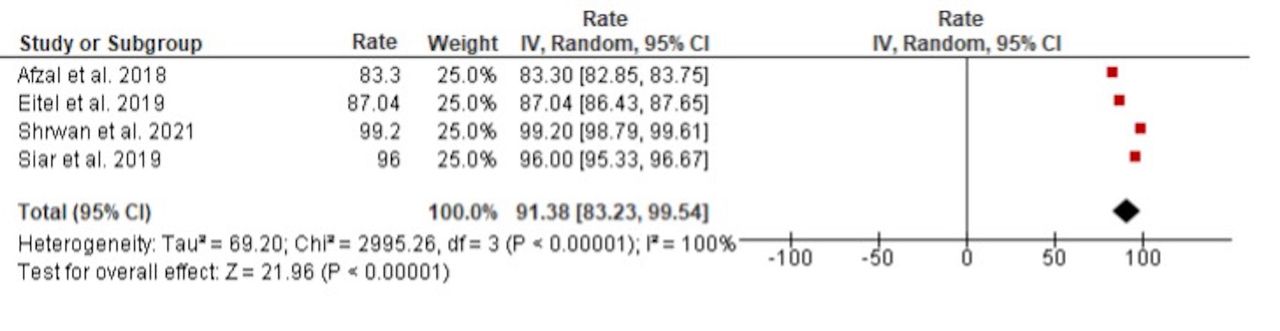
Accuracy
The heterogeneity was important (Chi2 = 2995.26, p<0.00001, I2=100%), so we used a random effects model. The analysis revealed that the overall accuracy rate was significantly high at 91.38 (95% CI: 83.23–99.54; p<0.00001) (Figure 6).

- Pooled accuracy rates of 2D-3D CNN in the classification of MS lesions.
Figure 6 pooled accuracy rates of 2D-3D CNN in the classification of MS lesions
Segmentation
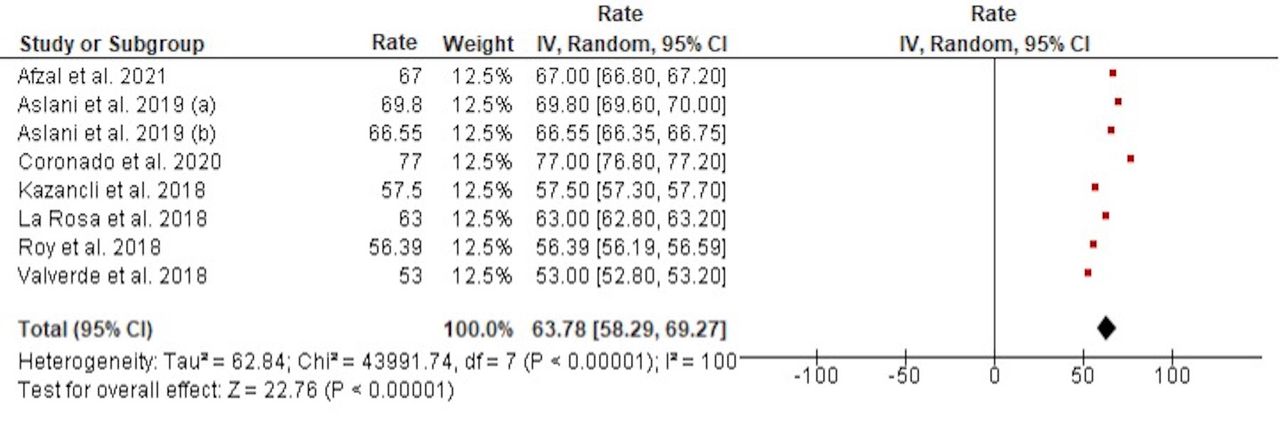
Eight of the 15 included studies examined the diagnostic performance of 2D- or 3D-CNN in segmenting MS lesions using the DSC.24,26–28,30–32,35
Dice Similarity Coefficient
The heterogeneity was important (Chi2=43991.74, p<0.00001, I2 = 100%), so we used a random effects model. The analysis showed that the overall DSC was significantly high at 63.78 (95% CI: 58.29–69.27; p<0.00001) (Figure 7).

- Pooled DSC of 2D-3D CNN in the segmentation of MS lesions.
Subgroup and sensitivity analyses
Subgroup and sensitivity analyses were performed for DSC outcome. The small number of articles led to the exclusion of the remaining outcomes. Exploratory subgroup analysis proved that both country and DL architecture were a cause of heterogeneity for DSC outcome (p<0.00001) (Table 3). For the subgroup analysis of country, the highest DSC was detected in Italy (68,17%, 95%CI: 68.04, 68.3), followed by Australia (67.00%, 95%CI: 66.80, 67.20) and USA (66.70% 95%CI: 66.56, 66.83). However, the lowest DSC was revealed in Spain (55.25%, 95%CI: 55.11, 55.39). Regarding DL architecture, 2D CNN showed a higher DSC (64.94%, 95%CI: 64.84, 65.03) than 3D CNN did (62.63%, 95%CI: 62.53, 62.72).
- Subgroup analysis.
A sensitivity analysis was carried out to determine the source of heterogeneity in the pooled rate of DSC. The finding showed that the outcomes were not significantly different between studies, suggesting that this metaanalysis is reliable. Indeed, the rate of DSC was ranged from 61.89% (95% CI: 57.20, 66.58) to 65.32% (95% CI: 60.02, 70.62) (Table 4).
- Leave-one-out analysis of the rate of DSC.
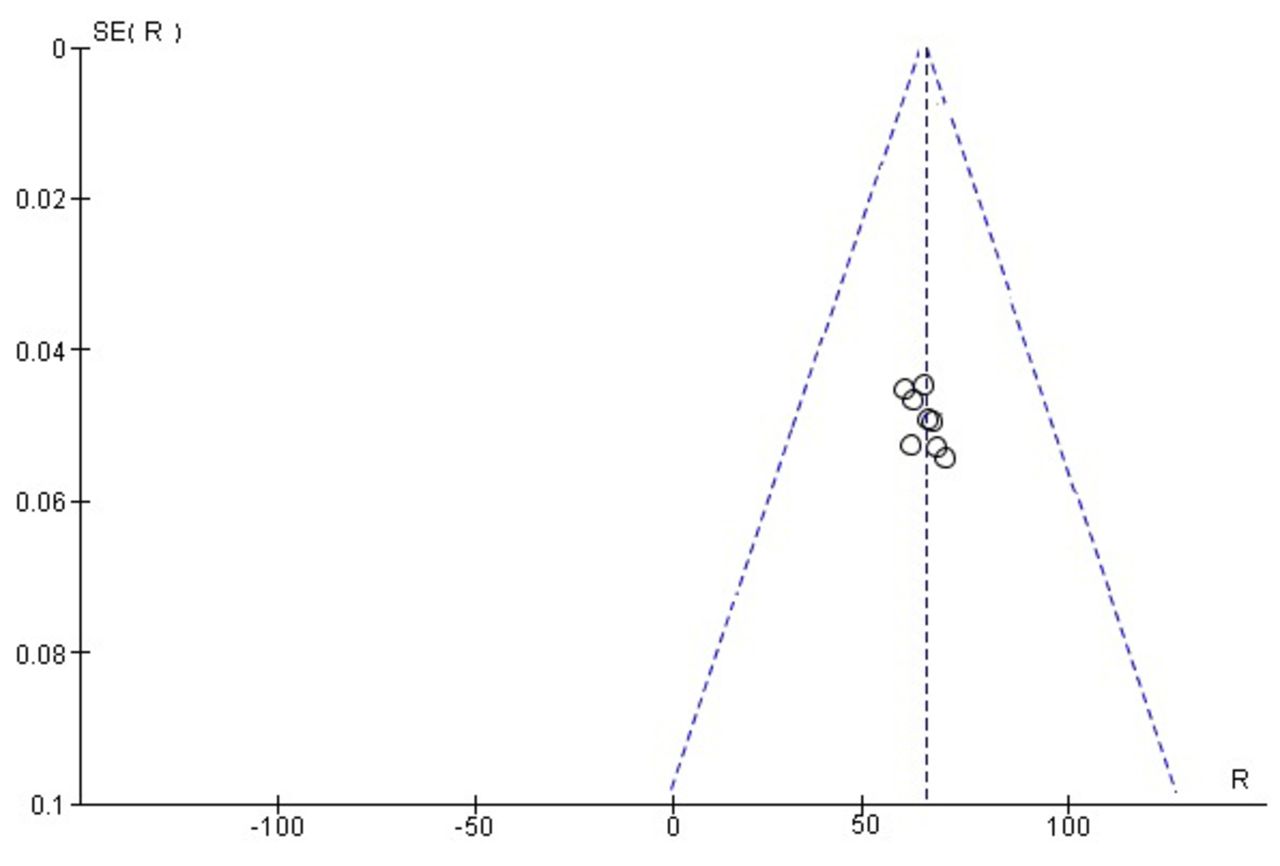
The results of Egger’s test showed that there was no publication bias for the DSC outcome (p>0.05). Similarly, the distribution of articles displayed symmetry in the funnel plot (Figure 8). The small number of articles led to the exclusion of the remaining out-comes. Figure 8. Funnel plot of DSC in studies investigating the segmentation of MS lesions

- Funnel plot of DSC in studies investigating the segmentation of MS lesions
Discussion
The medical sciences include many fascinating research areas, including disease prediction. The application of computer vision has led to the suggestion of numerous tools. The CNS is impacted by diseases that are ongoing, autoimmune, and demyelinating, such as MS. This harms the myelin sheath, inducing changes in the structure of the brain.38 Consequently, it can cause disability in young people, which has a significant effect on the quality of life.39 MS is a condition that has significant clinical implications, for which automated detecting algorithms are required to aid physicians in its early detection and faster implementation of specialist treatment. During the past decades, CNN, which are a ML method, have become amongst the most widely used tools in image segmentation tasks with high efficiency.40
The results of this analysis show that there has been an increase in interest over the past several years in using DL approaches for segmentation and classification of MS imaging investigations.
This metaanalysis evaluates the diagnostic effectiveness of 2D-3D CNN architectures using MRI data in the diagnosis of MS. The findings obtained revealed that the pooled results of 2D-3D CNN methods present a great specificity, sensitivity, and accuracy (>98%) in the identification of MS lesions. Compared to conventional techniques, they have excellent results with MS lesions.41 For example, gray level cooccurrence matrix (GLCM) and hybrid image enhancement (HIE), which are traditional methods, presented accuracy values of 95.14% and 95.98%, respectively.42,43 DL-based algorithms outperform conventional image processing techniques in terms of specificity, sensitivity, and accuracy requirements. As a result, 2D-3D CNN networks can effectively extract the features of MS lesions from MRI images. The quantity of network parameters that significantly affect network training time is another factor that can be considered in deep networks. It was revealed that 2D-3D CNN method with a smaller number of parameters provides better accuracy than other methods (traditional or DL).25 Similarly, three techniques: stochastic pooling, dropout, and batch normalization, associated with a 14-layer CNN, were developed by Wang et al. for MS identification.36 Compared to other cutting-edge methods, the suggested 2D-CNN method showed the best performance in terms of sensitivity, specificity, precision, and accuracy.36
In order to diagnose and treat MS disease as early as possible, Wang et al. constructed a 14-layer CNN together with batch normalization, dropout, and stochastic pooling algorithms.36 During the current investigation, imaging data were collected on 26 healthy volunteers and 38 MS patients from the eHealth laboratory. Results showed that the proposed 14-layer CNN network performed better than all of the aforementioned techniques when compared to maximum pooling, average pooling, five traditional AI methods, and a deep learning method. The proposed method had sensitivity, specificity, and accuracy of 98.77%, 98.76%, and 98.77%, respectively. On the other hand, Zhang et al. proposed a new 10-layer CNN that combines dropout and parametric rectified linear unit algorithms.37 The results outperformed four cutting-edge methods and presented sensitivity, specificity, and accuracy of 98.22%, 98.24%, and 98.23%, respectively.
Concerning classification of MS lesions, different 2D- and 3D-CNN methods were suggested to support categorization choices for clinical reviews, confirm diagnosis relevant traits, and maybe gather more knowledge about MS condition. Afzal et al23 proposed an automated 2D-CNN algorithm using DL that can forecast whether a clinically isolated illness would develop into MS within a year of follow up. Additionally, it was computationally simple and resilient in nature. McKinley et al44 obtained sensitivity up to 72% in MS classification on 2 separate external validation sets. Similarly, Narayana et al45 achieved a sensitivity up to 72% on patient‑basis versus sensitivity up to 78% on a slice‑basis in the same study. In this context, Eitel et al. built a methodology to reveal CNN choices for classification of MS lesions based on FLAIR data and layer-wise relevance propagation.29 Specifically, they showed that CNN models are capable of successfully separating MS patients and controls on a typically sized neuroimaging cohort (Accuracy=87.04%). Furthermore, layer-wise relevance propagation is extremely helpful in both explaining individual network decisions as well as generally assisting in determining whether CNN models have learned significant features.
Similarly, both 2D- and 3D-CNN models showed robust segmentation of MS lesions. Rehan Afzal et al. developed a 2D patch-wise CNN that can segment MS lesions more precisely and firmly.24 This method showed consistently higher sensitivity and precision than other traditional methods. With a precision of up to 90%, it can precisely and dependably distinguish MS lesions from images taken by different MRI scanners. As a result, doctors may automatically segment lesions without wasting time, which improves disease monitoring. In another study, Coronado et al. showed excellent segmentation by enhancing lesions using a 3D-CNN model and multispectral MRI.28 With a testing DSC of 91%, Narayana et al.45 offered a FLAIR based lesion segmentation, and Sander et al.46 used a multidimensional gated recurrent unit model to achieve performance up to DSC 97%. To address the issue that MS lesions vary greatly in size and that DSC is not differentiable, making it unable to employ directly Wang et al.47 segregate large and small lesions for gradient descent and suggest a new activation function to ease network training. Aslani et al.27 employ 2D slices as input and a 2D encoder-decoder network to segment MS lesions in order to avoid issues like patch-wise approaches’ oversight of global information and 3D segmentation’s overfitting because of the class imbalance issue.
Based on the rising accessibility of larger datasets, the development of computer aided diagnosis methods for the early detection of MS disease is of utmost relevance. Such systems, which offer cloud based AI services, can improve physicians’ diagnostic experiences and present improved diagnostic prospects, particularly in remote places where access to specialists is typically limited. In order to accomplish the objective of using AI algorithms in clinical practice in the actual world, all of these directions for the future of DL in MS must foster explainability and trustworthiness in addition to greater performance.
Strengths and limitations
This study investigates the diagnostic performance of CNN-based MRI in the identification, classification, and segmentation of MS lesions, taking studies from various countries into consideration. In the current investigation, we searched six different databases. The key advantages of this paper are the wide scope of datasets and the acceptable sample size. We also demonstrated the superior caliber of the included research, which had an acceptable quality grade. Our systematic review and metaanalysis have few limitations. First, there were limited papers included in this work. Moreover, a high heterogeneity was detected across papers detailing diagnostic effectiveness of 2D-3D CNN in the segmentation and classification of MS lesions. Regarding the subgroup analysis, variations in the study locations and DL architectures could be sources of heterogeneity. The results’ interpretability may change as a result of substantial heterogeneity, which is expected in metaanalysis investigations.48 Hence, the results of this metaanalysis need to be carefully considered. Despite these drawbacks, the main advantage of this work is the high methodological quality of the studies. Furthermore, the sensitivity analysis demonstrated that the calculated DSC rate was accurate and unaffected by the omission of a single study.
Conclusion
The present metaanalysis shows that 2D-3D CNN algorithms using MRI data present excellent performance in the identification, classification, and segmentation of MS lesions. However, using them directly in clinical practice is still challenging. Hence, more DL algorithms should be developed and improved for more efficacious and rapid MS diagnosis.
Acknowledgement
The authors would like to thank Proof-Reading-Service.com (www.proof-reading-service.com) for English language editing. Further, this research holds no conflict of interest and is not funded through any source.
Footnotes
Disclosure. Authors have no conflict of interests, and the work was not supported or funded by any drug company.
- Received October 15, 2023.
- Accepted January 6, 2024.
- Copyright: © Neurosciences
Neurosciences is an Open Access journal and articles published are distributed under the terms of the Creative Commons Attribution-NonCommercial License (CC BY-NC). Readers may copy, distribute, and display the work for non-commercial purposes with the proper citation of the original work.
References
In this issue


Jump to section
Related Articles
Cited By...
- No citing articles found.